
The Panel platform reporting module allows tabular reports to be generated and displayed in the browser or downloaded as a file. You can generate reports to include up to 200,000 objects, and this number can be increased within the configuration settings as your system resources allow for it.
Two key features of the reporting interface are file download and point-in-time reports. Reports may be downloaded as Excel, Tab Delimited, HTML, JSON, or XML files. The point-in-time report feature allows reports to be constructed as if they were being viewed a particular timestamp in the past.
Reports can be used to query, aggregate, join, and group any data collected by Identity Panel.
Viewing Reports
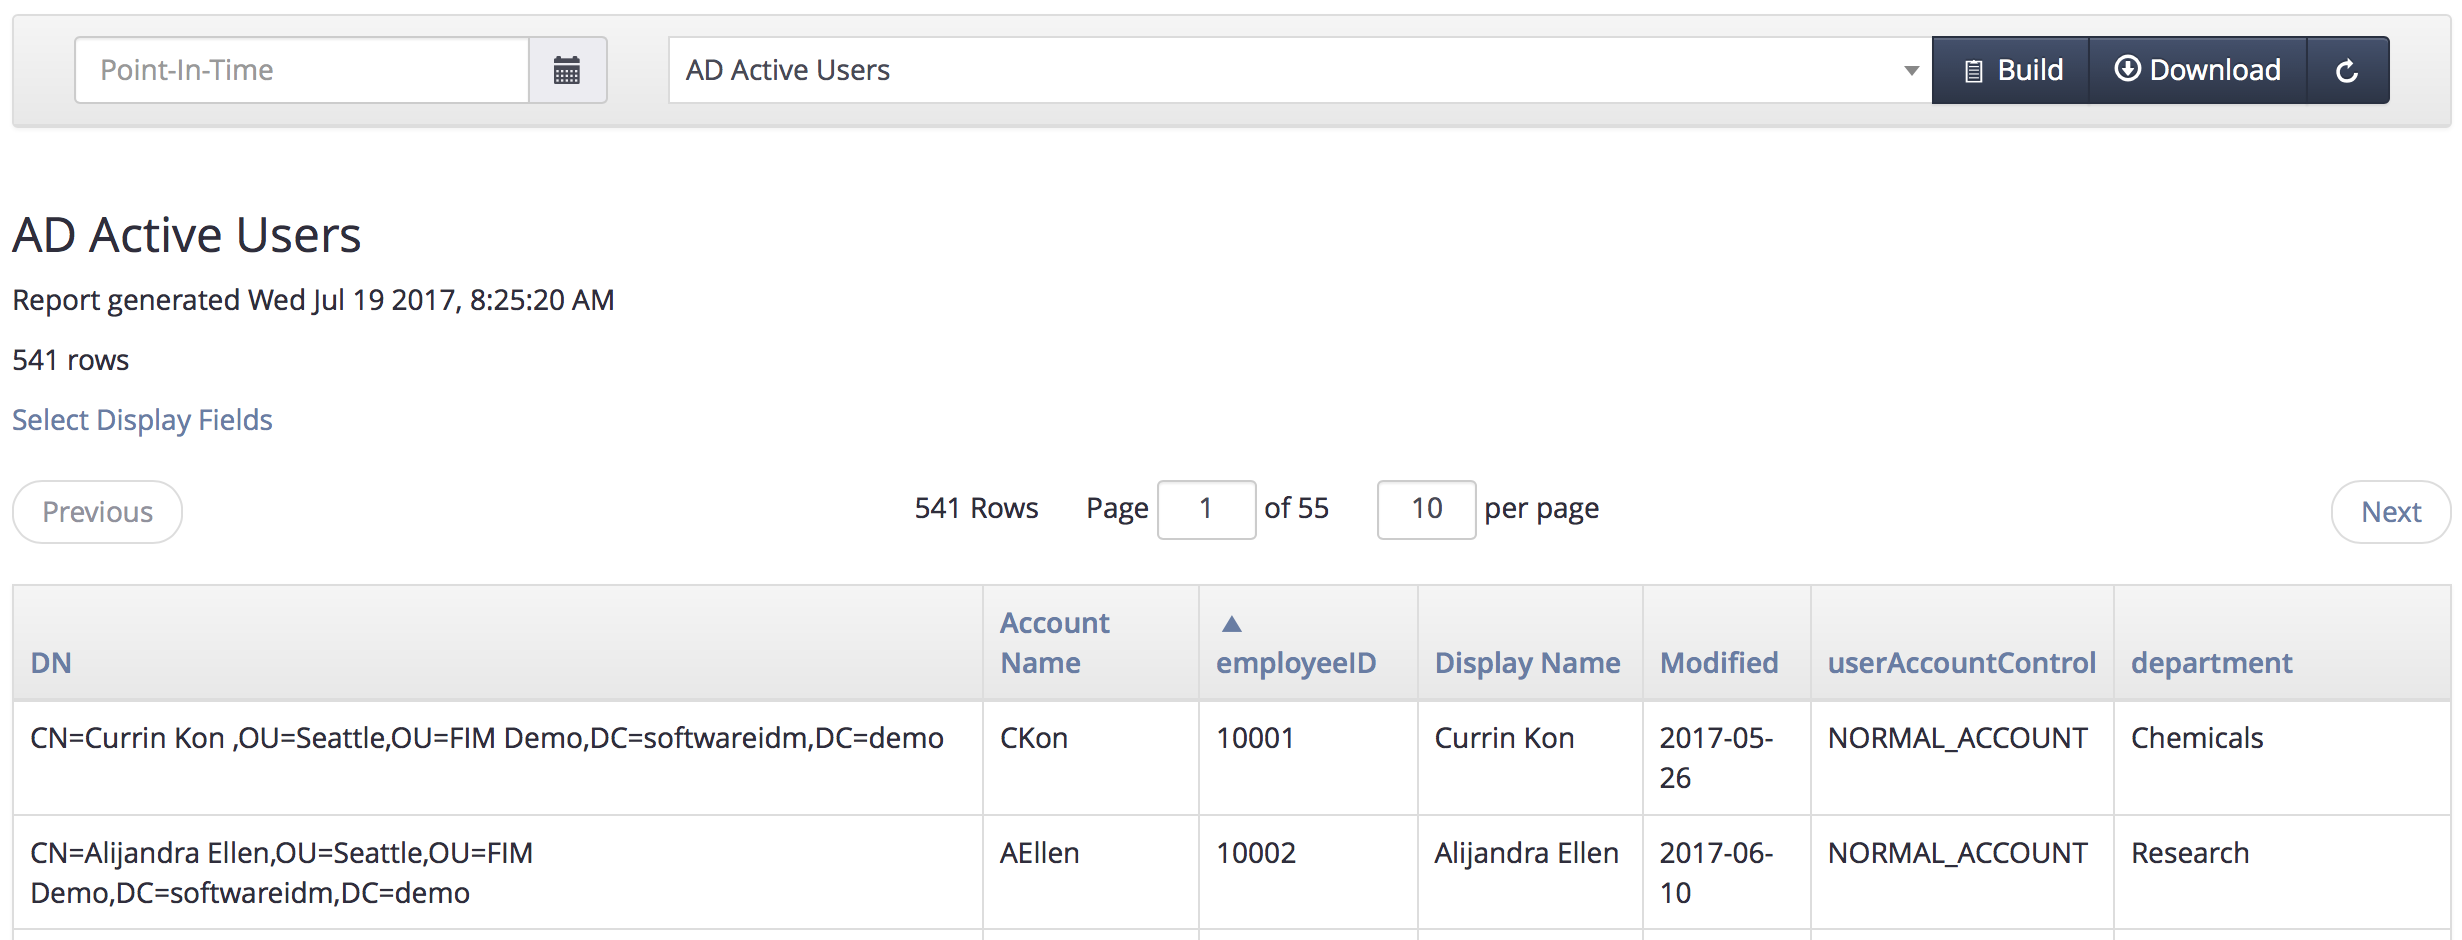
Reports are viewed using the Reports tab in Identity Panel. When you first navigate to the reports tab it displays "No Report Selected".
Choose a report from the dropdown and optionally enter a date in the Point-in-Time text box.
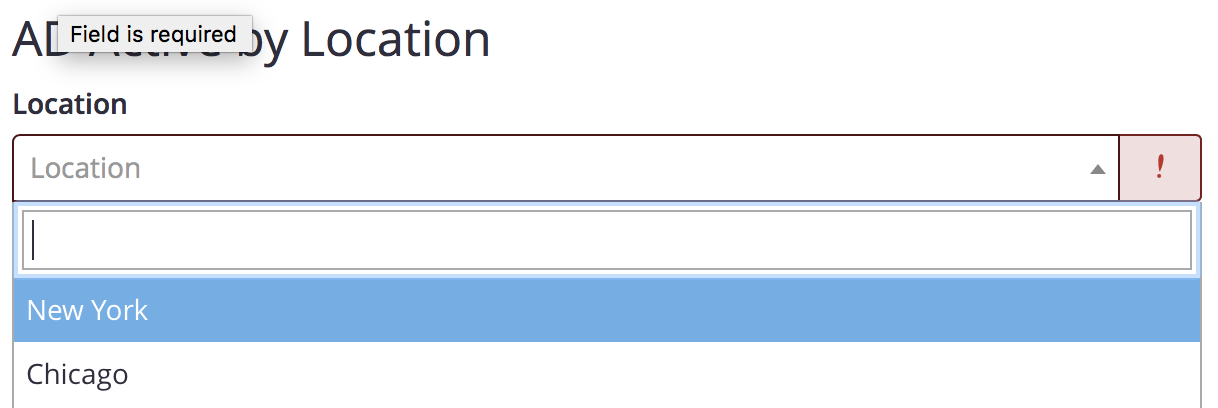
If the report definition includes parameters it may be necessary to provide values.
Then press the "Build" button.
Building a point-in-time report generates the report as if it had been viewed on the date selected. Point-in-time reports may take longer to generate, since Identity Panel must query more of the data from the database and convert it based on timestamps before it can apply query filters.
After a report is built you may download it as an Excel, Delimited, HTML, JSON, or XML file. Simply choose the desired format and press the download button.
Comments
0 comments
Please sign in to leave a comment.